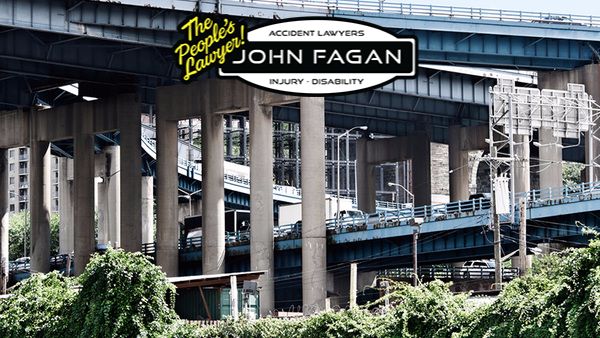
Rusty, crumbling roads, overpasses and bridges in New York City, seen here, provide a glimpse of the many problems facing U.S. drivers across the nation. (Photo: Shutterstock)
It’s pretty obvious to most drivers that roads in the United States, especially the interstate highway system, are in disrepair.
Potholes and uneven road surfaces are the most obvious problems. But all over the country, roads are crumbling and bridges are in danger of falling down.
As roads get worse, the potential for accidents increases, and drivers may have more flat tires, broken axles and cracked windshields, leading to more auto insurance claims.
To provide an overview of the status of the country’s infrastructure, every four years, the American Society of Civil Engineers (ASCE) provides a comprehensive assessment of 16 major categories in ASCE’s Infrastructure Report Card. Using a simple A to F school report card format, the Report Card examines current infrastructure conditions and needs, assigns grades and makes recommendations to raise them.
In addition to providing a national report card, ASCE prepares state and regional report cards, on a rolling basis, following the same methods and grading system.
A — Exceptional, fit for the future.
B — Good, adequate for now.
C — Mediocre, requires attention.
D — Poor, at risk.
F — Failing/critical, unfit for purpose.
Overall, ASCE gives U.S. roads a grade of D. They are often crowded, frequently in poor condition, chronically underfunded, and are becoming more dangerous, ASCE says. More than two out of every five miles of the U.S. urban interstates are congested, and traffic delays cost the country $160 billion in wasted time and fuel in 2014. One out of every five miles of highway pavement is in poor condition, and U.S. roads have a significant and increasing backlog of rehabilitation needs.
Related: 10 ways cities can enhance risk management and build resilience
How did the roads get so bad? ASCE points out that the U.S. has more than four million miles of roads crisscrossing the United States, from 15-lane interstates to residential streets. In 2016 alone, U.S. roads carried people and goods over three trillion miles — or more than 300 round trips between Earth and Pluto.
Here are the 10 states with the worst roads in the country and key facts about each one, according to ASCE:
(Photo: Shutterstock)
1. Connecticut: 57 percent
21,512 miles of public roads, with 57 percent in poor condition.
338 (8 percent) of the 4,214 bridges are structurally deficient.
$864 per motorist per year in costs from driving on roads in need of repair.
Related: Here are the top 10 states people are moving from
(Photo: Shutterstock)
2. Rhode Island: 54 percent
16,691 miles of public roads, with 54 percent in poor condition.
192 (24.9 percent) of the 772 bridges are structurally deficient.
$810 per motorist per year in costs from driving on roads in need of repair.
Related: Hail, water and wind are top auto perils between March and May
(Photo: Shutterstock)
4. Hawaii: 39 percent
64 (5.7 percent) of the 1,132 bridges are structurally deficient.
4,455 miles of public roads, with 39 percent in poor condition.
$708 per motorist per year in costs from driving on roads in need of repair.
Related: Volcano claims and coverage
(Photo: Shutterstock)
7. Washington: 31 percent
392 (4.8 percent) of the 8,178 bridges are structurally deficient.
14,252 miles of public roads, with 31 percent in poor condition.
$656 per motorist per year in costs from driving on roads in need of repair.
Related: Here are the top 10 states people are moving into
(Photo: Shutterstock)`
8. Mississippi: 28 percent
2,098 (12.3 percent) of the 17,068 bridges are structurally deficient.
76,777 miles of public roads, with 28 percent in poor condition.
$705 per motorist per year in costs from driving on roads in need of repair.
Related: 10 poorest states in America
(Photo: Shutterstock)
9. New York: 28 percent
1,928 (11 percent) of the 17,462 bridges are structurally deficient.
114,365 miles of public roads, with 28 percent in poor condition.
$571 per motorist per year in costs from driving on roads in need of repair.
Related: Could high-speed passenger trains be in our future?
(Photo: Shutterstock)
10. Wisconsin: 27 percent
1,232 (8.7 percent) of the 14,230 bridges are structurally deficient.
80,338 miles of public roads, with 27 percent in poor condition.
$637 per motorist per year in costs from driving on roads in need of repair.
Related: Top 10 personal auto carriers for 2016, as ranked by NAIC